|
How
does an AVLELEC Soundmasking System Work? SAMPLE WHITE NOISE RECORDINGS White Noise White Paper |
www.AVLELEC.com www.SoundmaskingInstallation.com in association with www.TURNSTILES.us GSA No. GS-07F-9239S INTERNET MERCHANT SINCE 1997 ESTABLISHED MAY 1990 303-670-1099 |
Affiliate Links Policies Client List Customer Comments Value Added Service AutoCAD Drawings |
This publication is intended to complement the EPA's "Levels Document,"* the 1974 report examining levels of environmental noise necessary to protect public health and welfare. It interprets the contents of the Levels Document in less technical terms for people who wish to better understand the concepts presented there, and how the protective levels were identified. In that sense, this publication may serve as an introduction, or a supplement, to the Levels Document.
*"Information on Levels of Environmental Noise Requisite to Protect Public Health and Welfare with an Adequate Margin of Safety," EPA/ONAC 550/9-74-004, March, 1974.
During the last 20 years there has been increasing concern with the quality of the environment. Along with air and water contaminants, noise has been recognized as a serious pollutant. As noise levels have risen, the effects of noise have become pervasive and more apparent.
Noise is defined as "unwanted sound." In the context of protecting the public health and welfare, noise implies adverse effects on people and the environment. Noise causes hearing loss, interferes with human activities at home and work, and is in various ways injurious to people's health and well-being. Although hearing loss is the most clearly measurable health hazard, noise is also linked to other physiological and psychological problems.
Noise annoys, awakens, angers and frustrates people. It disrupts communication and individual thoughts, and affects performance capability. Noise is one of the biological stressors associated with everyday life. Thus, the numerous effects of noise combine to detract from the quality of people's lives and the environment.
Noise emanates from many different sources. Transportation noise, industrial noise, construction noise, household noise, and people and animal noise are all large-scale offenders. It is important, then, to examine the total range and combination of noise sources and not to focus unduly on any one source.
Through the Noise Control Act of 1972, Congress directed the Environmental Protection Agency (EPA)to publish scientific information about the kind and extent of all identifiable effects of different qualities and quantities of noise. EPA was also directed to define acceptable levels under various conditions which would protect public health and welfare with an adequate margin of safety. The EPA collaborated with other Federal agencies and the scientific community to publish a "Levels Document,"* which would fulfill these requirements in the Noise Control Act.
Initial public reaction was quite favorable, but it was discovered that the document was too complex, too technical, and too long for some audiences. This summary presents the contents of the Levels Document in less technical terms. It defines the basic measurement of noise, analyzes noise exposure, and presents the best understood effects of noise - hearing damage, speech interference, and annoyance -using information contained in the Levels Document. The identified protective levels are then summarized, followed by a number of often-asked questions and answers about the Levels Document.
No attempt has been made here to incorporate recent research findings pertaining to effects of noise on people. Considerable new information has developed since initial publication of the Levels Document, including new findings on community response to noise, sleep disruption, and speech interference. Summaries and analyses of some recent information on noise effects are available through EPA and other agencies.
*"Information on Levels of Environmental Noise Requisite to Protect Public Health and Welfare with an Adequate Margin of Safety", EPA 550/9-74-004, March, 1974, U.S. Environmental Protection Agency, Washington, D.C. 20460.
The sound we hear is the result of a sound source inducing vibration in the air. The vibration produces alternating band of relatively dense and sparse particles of air, spreading outward from the source in the same way as ripples do on water after a stone is thrown into it. The result of the movement of the particles is a fluctuation in the normal atmospheric pressure, or sound waves. These waves radiate in all directions from the source and may be reflected and scattered or, like other wave actions, may turn corners. When the source stops vibrating, the sound waves disappear almost instantaneously, and the sound ceases. The ear is extremely sensitive to sound pressure fluctuations, which are convened into auditory sensations.
Sound may be described in terms of three variables:
1. Amplitude (perceived as loudness)
2. Frequency (perceived as pitch)
3. Time pattern
Sound pressure is the amplitude or measure of the difference between atmospheric pressure (with no sound present) and the total pressure (with sound present). Although there are other measures of sound amplitude, sound pressure is the fundamental measure and is the basic ingredient of the various measurement descriptors in the next section, "Measurement of Environmental Noise."
The unit of sound pressure is the decibel (dB); thus it is said that a sound pressure level is a certain number of decibels. The decibel scale is a logarithmic scale, not a linear one such as the scale of length. A logarithmic scale is used because the range of sound intensities is so great that it is convenient to compress the scale to encompass all the sounds that need to be measured. The human ear has an extremely wide range of response to sound amplitude. Sharply painful sound is 10 million times greater in sound pressure than the least audible sound. In decibels, this 10 million to 1 ratio is simplified logarithmically to 140 dB.
Another unusual property of the decibel scale is that the sound pressure levels of two separate sounds are not directly (that is, arithmetically) additive. For example, if a sound of 70 dB is added to another sound of 70 dB, the total is only a 3-decibel increase (to 73 dB), not a doubling to 140 dB. Furthermore, if two sounds are of different levels, the lower level adds less to the higher as this difference increases. If the difference is as much as 10 dB, the lower level adds almost nothing to the higher level. In other words, adding a 60 decibel sound to a 70 decibel sound only increases the total sound pressure level less than one-half decibel.
The rate at which a sound source vibrates, or makes the air vibrate, determines frequency. The unit of time is usually one second and the term "Hertz" (after an early investigator of the physics of sound) is used to designate the number of cycles per second.
The human ear and that of most animals has a wide range of response. Humans can identify sounds with frequencies from about 16 Hz (Hertz) to 20,000 Hz. Because pure tones are relatively rare in real-life situations, most sounds consist instead of a complex mixture of many frequencies.
The temporal nature of sound may be described in terms of its pattern of time and level: continuity, fluctuation, impulsiveness, intermittency. Continuous sounds are those produced for relatively long periods at a constant level, such as the noise of a waterfall. Intermittent sounds are those which are produced for short periods, such as the ringing of a telephone or aircraft take-offs and landings. Impulse noises are sounds which are produced in an extremely short span of time, such as a pistol shot or a hand clap. Fluctuating sounds vary in level over time, such as the loudness of traffic sounds at a busy intersection.
EPA has adopted a system of four "sound descriptors" to summarize how people hear sound and to determine the impact of environmental noise on public health and welfare. These four descriptors are: the A-weighted Sound Level, A-weighted Sound Exposure Level, Equivalent Sound Level, and Day-Night
Sound Level. They are related but each is most useful for a particular type of measurement. The descriptors and some examples of their uses are described below.
One's ability to hear a sound depends greatly on the frequency composition of the sound. People hear sounds most readily when the predominant sound energy occurs at frequencies between 1000 and 6000 Hertz (cycles per second). Sounds at frequencies above 10,000 Hertz (such as high-pitched hissing) are much more difficult to hear, as are sounds at frequencies below about 100 Hz (such as a low rumble). To measure sound on a scale that approximates the way it is heard by people, more weight must be given to the frequencies that people hear more easily.
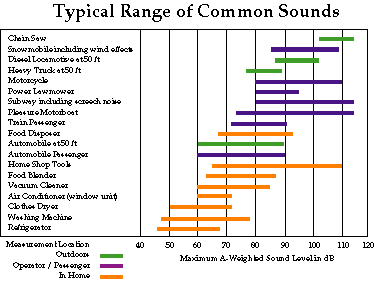
A method for weighting the frequency spectrum to mimic the human ear has been sought for years. Many different scales of sound measurement, including A-weighted sound level (and also B, C, D, and E-weighted sound levels) have evolved in this search. A-weighting was recommended by EPA to describe environmental noise because it is convenient to use, accurate for most purposes, and is used extensively throughout the world. Figure 1 shows the A-weighted levels of some environmental noises. Note that these ranges of measured values are the maximum sound levels.
The A-weighting of frequency also is used in the three descriptors discussed below. When used by itself, an A-weighted decibel value denotes either a sound level at a given, instant, a maximum level, or a steady-state level. The following three descriptors are used to summarize those levels which vary over time.
Since the levels of many sounds change from moment to moment, this variation must also be accounted for when measuring environmental noise. One method for measuring the changing magnitude of sound levels is to trace a line on a sheet of moving paper, so that the movement of the pen is proportional to the sound level in decibels. Figure 2 illustrates such a recording, about which several features are noteworthy. First, the sound level varies with time over a range of about 30 dB. Second, the sound appears to be characterized by a fairly steady-state lower level, upon which are superimposed sound levels associated with individual events. This fairly constant lower level is often called the background ambient sound level.
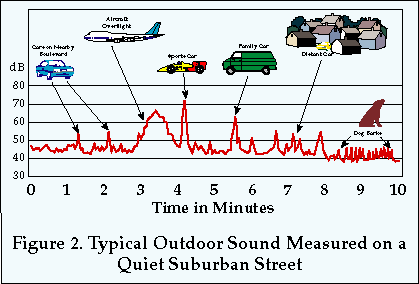
Each single event in Figure 2 may be partially characterized by its maximum level. It may also be partially characterized by its time pattern. In the example, the sound level of the aircraft is above that of the background ambient level for about a minute, whereas the sound levels from cars are above the background level for much less time.
The duration of sounds with levels that vary from moment to moment is more difficult to characterize. One way is to combine the maximum sound level with the length of time during which the sound level is greater than a certain number of decibels below the maximum level -- for example, the number of seconds that the sound rises from 10 dB below maximum, as in Figure 3.
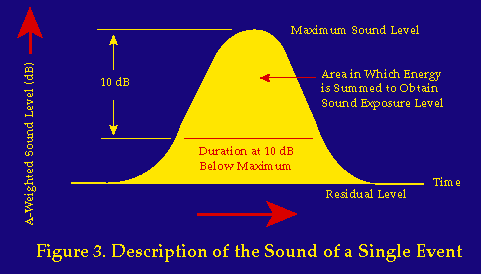
Using this procedure one can measure the total energy of the sound by summing the intensity during the exposure duration. This procedure produces the second measurement descriptor, sound exposure level (Ls), referred to in the Levels Document as the single event noise exposure level (SENEL).
Yet another method of quantifying the noise environment is to determine the value of a steady-state sound which has the same A-weighted sound energy as that contained in the time-varying sound. This is the third measurement descriptor, termed the Equivalent Sound Level (Leq). The Equivalent Sound Level is a single value of sound level for any desired duration, which includes all of the time-varying sound energy in the measurement period. In Figure 2, for example, the Leq equals about 58 dB, indicating that the amount of sound energy in all the peaks and valleys in the figure is equivalent to the energy in a continuous sound of 58 dB.
The major virtue of the Equivalent Sound Level is that it correlates reasonably well with the effects of noise on people, even for wide variations in environmental sound levels and time patterns. It is used when only the durations and levels of sound, and not their times of occurrence (day or night), are relevant. It is easily measurable by available equipment. It also is the basis of a fourth and final measurement descriptor of the total outdoor noise environment, the Day-Night Sound Level (Ldn).
The Day-Night Sound Level is the A-weighted equivalent sound level for a 24-hour period with an additional 10 dB weighting imposed on the equivalent sound levels occurring during nighttime hours (10 pm to 7 am). Hence, an environment that has a measured daytime equivalent sound level of 60 dB and a measured nighttime equivalent sound level of 50 dB, can be said to have a weighted nighttime sound level of 60 dB (50 + 10) and an Ldn of 60 dB. Examples of measured Ldn values are shown in Figure 4.
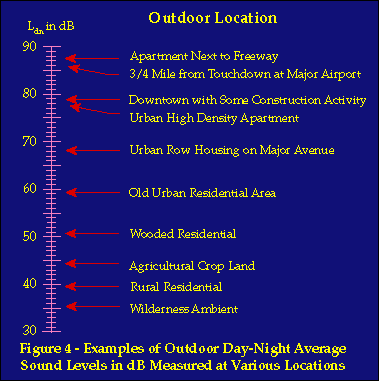
Table 1 summarizes the use of the four sound descriptors used by EPA.
| TYPICAL USE | NAME OF DESCRIPTOR | NATURE OF DESCRIPTOR |
|---|---|---|
| To describe steady air-conditioning sound in a room or measure maximum sound level during a vehicle passby with a simple sound level meter. | A-weighted Sound Level | The momentary magnitude of sound weighted to approximate the ear's frequency sensitivity. |
| To describe noise from a moving source such as an airplane, train, or truck. | A-weighted Sound Exposure Level | A summation of the energy of the momentary magnitudes of sound associated with a single event to measure the total sound energy of the event. |
| To measure average environmental noise levels to which people are exposed. | Equivalent Sound Level | The A-weighted sound level that is "equivalent" to an actual time varying sound level, in the sense that it has the same total energy for the duration of the sound. |
| To characterize average sound levels in residential areas throughout the day and night. | Day-Night Sound Level | The A-weighted equivalent sound level for a 24-hour period with 10 decibels added to nighttime sounds (10 pm - 7 am). |
In residential areas of the United States, major contributions to outdoor noise come from transportation, industrial, construction, human and animal sources. Inside homes, appliances, radio and television, as well as people and animals, are predominant noise sources. On the job, workplace equipment can create moderate to extremely high levels of noise. The daily noise exposure of people depends on how much time they spend in different outdoor and indoor locations and on the noise environments in these places. Typical daily exposure patterns are discussed in this section, following short descriptions of outdoor and indoor levels of environmental noise throughout the United States.
The noise environment outside residences in the United States can be highly variable. As seen in Figure 4, outdoor Day-Night Sound Levels in different areas vary over a range of 50 dB. Levels occur as low as Ldn = 30 to 40 dB in wilderness areas and as high as Ldn = 85 to 90 dB in urban areas.
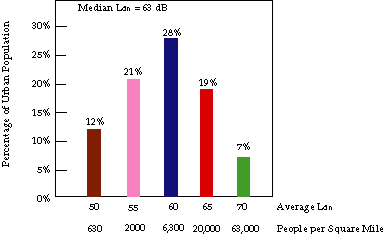
Most Americans live in areas with a much smaller ranger of outdoor noise levels. Figure 5 shows that for urban dwellers (roughly 135 million people, more than half the U.S. population), 87% live in areas of Ldn = 48 and higher from traffic noise alone. Most of the other 13% of the urban population experience lower noise levels than those of Figure 5. Figure 5 also shows that nearly half of the urban population live in areas exposed to traffic sounds that range over only 5 dB (Ldn = 55 to 60 dB). Rural populations enjoy average outdoor sound levels generally lower than Ldn = 50 dB.
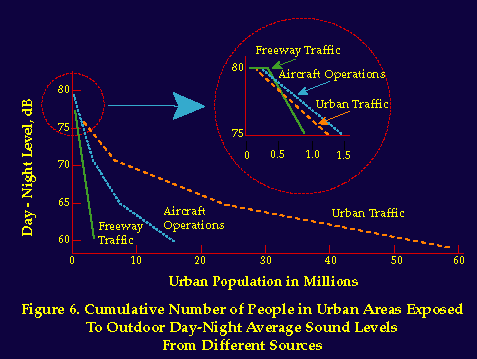
It is useful to know the number of people living in areas characterized by different levels of environmental noise. Figure 6 presents estimates for urban traffic, freeway traffic, and aircraft noise. The figure shows that urban traffic noise is much more widespread than either aircraft or freeway noise, but the figures are not strictly additive, because many of the people counted in one category are also exposed to another category of noise. Fifty-nine million people live in areas with urban traffic noise of Ldn = 60 dB or higher, in contrast to only 16 million and 3.I million people who live in areas with outdoor levels of Ldn = 60 dB or higher for aircraft and freeway noise, respectively. On the other hand, more people are exposed to higher levels of noise from freeway and aircraft operations than from urban traffic: about 300,000 people live in areas exposed to levels of Ldn = 80 dB or higher from freeway traffic; 200,000 from aircraft operations; and 100,000 from urban traffic. Bear in mind, however, that there may be differences between individual at-ear exposure levels and outdoor levels, because people move from place to place for varying amounts of time.
The contribution of outdoor noise to indoor noise levels is usually small. That pan of a sound level within a building caused by an outdoor source obviously depends on the source's intensity and the sound level reduction afforded by the building. Although the sound level reduction provided by different buildings differs greatly, dwellings can be categorized into two broad classes-- those built in warm climates and those built in cold climates. Further, the sound level reduction of a building is largely determined by whether its windows are open or closed. Table II shows typical sound level reductions for these categories of buildings and window conditions, as well as an approximate national average sound level reduction.
| Windows Opened | Windows Closed | |
|---|---|---|
| Warm Climate |
|
|
| Cold Climate |
|
|
| Approximate National Average |
|
|
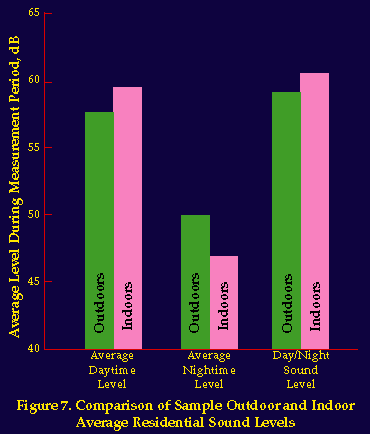
Sample measurements of outdoor and indoor noise levels during 24-hour periods are depicted in Figure 7. Despite the sound level reduction of buildings, indoor levels are often comparable to or higher than levels measured outside. Thus, indoor levels often are influenced primarily by internal noise sources such as appliances, radio and television, heating and ventilating equipment, and people. However, many outdoor noises may still annoy people in their homes more than indoor noises do. Indeed, people sometimes turn on indoor sources to mask the noise coming from outdoors.
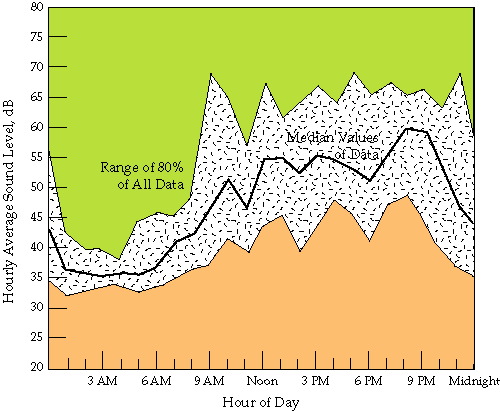
An example of the range of hourly sound levels measured inside living areas in plotted for each hour of the day in Figure 8. The figure shows the median levels and the range of levels observed for 80% of the data. During late night hours the typical hourly sound level was approximately 36 dB. This level was probably dominated by outdoor noise. However, during the day, the hourly average levels ranged from about 40 to 70 dB, indicating the wide range of activities in which people engage.
During a 24-hour period, people are exposed to a wide range of noises, including noise at home, work, school, places of recreation, shopping establishments, and while enroute to these or other. locations. Clearly, no single exposure pattern can be typical of all people, or even of those people who follow a common life style. Figure 9 shows hypothetical exposure patterns for broad classes of people. From these levels and some assumptions about the hours spent at different daytime activities, 24-hour average sound levels can be estimated for factory and office workers, housewives, and preschool and school-age children. Estimates based on these assumptions are found in Table III.
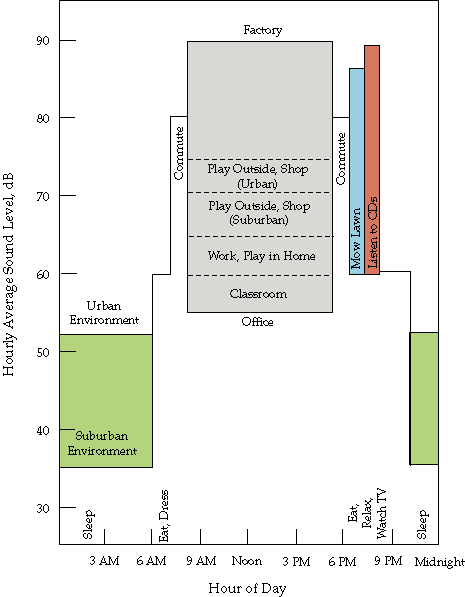
For most people, nighttime noises do not contribute significantly to the 24-hour average. For many, the 24-hour average is determined primarily by the noise exposure of a single activity, frequently occurring for a short period of time.
| Individual | Urban Environment | Suburban Environment |
|---|---|---|
| Factory Worker |
|
|
| Office Worker |
|
|
| Housewife |
|
|
| School Child |
|
|
There is no question that exposure to certain levels of noise can damage hearing. However, determining exposure levels that protect hearing with an adequate margin of safety is a complicated matter.
This is because hearing is a complex ability that cannot be summarized by a single number in the way an individual's height or weight can be described. In fact, sizable differences exist between individuals' hearing abilities. Hearing acuity tends to change progressively with age. Also, environmental noise exposure may vary considerably from moment to moment, so that specification of protective levels should include dynamic considerations. Further, relationships between hearing damage and noise exposure must be inferred, since available scientific information was gathered from groups of people who differed not only in noise exposure, but also in other important ways. Finally, individual and group noise exposures (especially over a working lifetime) are rarely known with precision.
In reaching conclusions about hearing loss, then, one must rely to a degree on assumptions, hypotheses, and extrapolations from existing data. Since complete agreement within the scientific community on these matters is lacking, an attempt was made in the Levels Document to consider alternative assumptions and hypotheses to ensure that the methods used to derive protective levels were based on the most defensible practice. As new data become available these levels may change slightly.
1. Changes in ability to hear in the region of 4000 Hz are the most important signs of irreversible hearing loss, indicating actual physiological destruction within the hearing mechanism. This frequency is usually the first frequency affected when the ear is damaged by exposure to noise. Furthermore, the protection of hearing acuity at this frequency is critical for understanding of speech and appreciation of music and other sounds.
2. Changes in individual hearing level, like changes in height or weight, are only significant if they are sizable. Changes smaller than 5 dB are considered insignificant.
3. At all ages, it is assumed that hearing acuity cannot be damaged by sounds that cannot be heard. This may be important in that aging and other causes may produce appreciable shifts in hearing.
4. Because hearing ability varies from person to person, recommendations must be made in terms of a critical percentage of the population, ranked with superior hearing over the remainder. EPA's recommendations were based on the 96th percentile-that is, on providing protection for 96% of the people. It is assumed that people with poorer hearing than the 96th percentile are not affected by noise of typical levels (see 3 above), so that the recommendations protect virtually the entire population.
5. An individual's total noise exposure is evaluated by an "equal energy" rule: two noise exposures are expected to produce equal hearing loss if the product of exposure intensity and exposure time are equal. This rule allows a 3-dB decrease in sound pressure level (expressed in dB) for each doubling of the duration. Thus an exposure of 76 dB for one hour is equivalent to 73 dB for two hours, or 70 dB for four hours. This procedure is probably accurate for exposures of 30 minutes or more. It is also more protective for very short exposures and for noise that fluctuates greatly in level.
6. Intermittent noise produces less hearing damage than the "equal energy" rule would predict. To be considered intermittent for this purpose, a noise must fall below 65 dB for 10% of each hour and have peaks that exceed the background level by 5 to 15 dB. Intermittent noise is assumed to produce 5 dB less effect than does continuous noise of the same average level.
Three major scientific studies have attempted to assess hearing damage for various noise exposures. All are based on a comparison of groups of noise-exposed people and comparable non-exposed groups. All three studies attempted to predict hearing loss as a function of noise exposure of a certain percentage of people. Because these studies were of exposure to high-level noise, extrapolations of the data were necessary to estimate the protective exposure level that would produce minimal hearing loss: less than 5 dB at 4000 Hz for 96% of the people.
Forty years of exposure (250 working days per year) to a noise level of 73 dB for 8 hours per day was calculated to produce a hearing loss smaller than 5 dB for 96% of the people. This is the basic datum used to calculate hearing-protective levels of noise exposure. To use it in specific situations, certain corrections must be applied. One correction is to determine the yearly (rather than working day) level (250 to 365 days). This consideration amounts to a reduction 1.6 dB. Another correction, based on exposure on a 24-hour rather than 8-hour basis, produces an additional reduction of 5 dB.
Table IV contains at-ear noise exposure levels that produce negligible hearing losses for both 8-hour and 24-hour exposure on a yearly and working day basis. The 8-hour calculation assumes the remaining 16 hours of the day are spent in relative quiet.
Since an individual often experiences intense noise exposure outside of working hours (for example, while using noisy appliances or pursuing noisy recreation), protection on a 24-hour basis 365 days per year requires exposure of an intermittent variety at an equivalent level of less than 71.4 dB. This value is rounded to 70 dB to provide a slight margin of safety. Exposure to greater levels would produce more than 5 dB hearing loss in at least some of the population.
| Steady (continuous) Noise | Intermittent Noise | With Margin of Safety | ||
|---|---|---|---|---|
|
|
365 day/year |
71.4 |
76.4 |
75 |
|
|
365 day/year |
66.4 |
71.4 |
70 |
Several assumptions have been made in calculating the 24-hour yearly hearing-protective level of 70 dB. It is reasonable to ask how alternative assumptions would affect this level, and what the range of error might be.
Q. How would the recommended level be affected by a change in the percentage of the population protected?
A. Reducing the 96th percentile value to the 50th percentile (i.e., protecting half the population) would increase the protective level value from 70 dB to 77 dB.Q. Since agreement on the value of the intermittency correction is imperfect, what other values might be used?
A. The estimated intermittency correction used in the Levels Document is 5 dB. The true intermittency correction is probably within the range 0 to 15 dB.Q. How accurate is the equal energy assumption?
A. The equal energy assumption when applied to the long times (8 hours to 24, or 250 to 365 days) is fairly accurate. It may be subject to errorQ. How meaningful are the basic studies of hearing damage risk?
A. The probable errors of estimates in the three basic studies cannot be stated with absolute accuracy. There are a number of problems in extrapolating percentages of the population damaged from relatively high exposure levels to the protective level. Also, there is the problem of determining the amount of hearing damage when the control (non-exposed) population is subject to high levels of non-occupational noise. Thus, the 70 dB protective level is simply the best present estimate, subject to change if better data become available.
Communication. is an essential element of human society, and speech is its most convenient form of expression. Interference with speech can degrade living directly, by disturbing normal social and work-related activities, and indirectly, by causing annoyance and stress. Sometimes the communications disturbed by noise are of vital importance, such as warning signals or cries for assistance. Prolonged speech interference and resulting annoyance are clearly not consistent with public health and welfare.
Speech interference from environmental noise can occur at home, at work, during recreation, inside vehicles, and in many other settings. Of chief concern for current purposes are the effects of noise on face-to-face conversations (indoors and outdoors), telephone conversations, and radio or television use.
The degree to which noise disturbs speech depends not only on physical factors (such as noise levels, vocal effort, distances between talkers and listeners, and room acoustics), but also on non-physical factors. The latter include the speaker's enunciation, the familiarity of the listener with the speaker's vocabulary and accent, the topic of conversation, the listener's motivation, and the hearing acuity of the listener. Years of research on speech intelligibility have produced considerable information about how these factors interact. Accurate predictions of speech intelligibility can be based on average noise levels and distances between speakers and listeners.
The solid line in Figure 10 shows the effects of steady masking noise on sentence intelligibility for persons with normal hearing in a typical living room. At distances greater than about one meter from the speaker, the level of speech is fairly constant throughout the room.
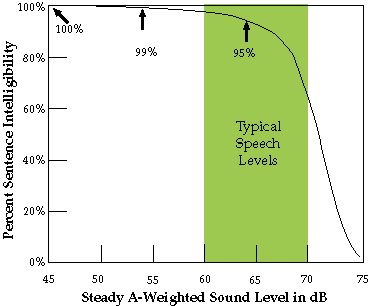
The highest noise level that permits relaxed conversation with 100% sentence intelligibility throughout the room is 45 dB. People tend to raise their voices when the background noise exceeds 45-50 dB.
The sound level of speech outdoors decreases with increasing distance between speaker and listener. Table V shows distances between speaker and listener for satisfactory outdoor speech intelligibility at two levels of vocal effort in steady background noise levels.
The levels for normal and raised-voice "satisfactory conversation" shown in Table V permit sentence intelligibility of 95% at each distance. Ninety-five percent sentence intelligibility usually permits reliable communication because of the redundancy in normal conversation.
If the noise levels in Table V are exceeded, the speaker and listener must either move closer together or expect reduced intelligibility. For example, consider a conversation at normal vocal effort at a distance of three meters in a steady background noise of 56 dB. If the background level increases to 66 dB, the speakers either will have to move closer (to one meter apart) to maintain the same intelligibility, or alternatively, raise their voices appreciably. If they remain three meters apart without raising their voices, speech intelligibility would drop considerably.
| COMMUNICATION DISTANCE (meters) | 0.5 | 1 | 2 | 3 | 4 | 5 |
| Normal Voice (dB) Raised Voice (dB) |
72 78 |
66 72 |
60 66 |
56 62 |
54 60 |
52 58 |
In summary, an Ldn of 45 dB permits virtually 100% intelligibility inside buildings. Assuming that a typical home reduces outdoor noise by 15 dB, the outdoor noise level should be no greater than Ldn = 60 dB to permit 100% intelligible speech indoors. Allowing a 5 dB. margin of safety, the outdoor level should be Ldn = 55 dB. This outdoor level would also guarantee sentence intelligibility of 95% outdoors with normal voice levels at a distance of three meters.
Q. What do percentages of sentence intelligibility signify?
A. A given percentage of sentence intelligibility, such as 95% or 99%, indicates the proportion of key words (in a group of sentences) which are correctly heard by normal-hearing listeners.Q. How are the speech criteria affected by the fact that people tend to raise their voices in noise?
A. The speech criteria are based on the principle that an adequate communication environment does not necessitate raised voices.Q. How do the identified continuous equivalent levels relate to the fact that, in everyday life, noise fluctuates and is intermittent in nature?
A. The Levels Document tabulated speech interferences for different combinations of levels and durations to test the limits of certain Leq values under intermittent conditions. It is acknowledged that, given equal Leq values, fluctuating noise may reduce less total speech interference than continuous noise on average. On the other hand, during those times when the higher level noises occur, the speech interference will be greater than its average value.
Noise interferes with human activities to varying degrees. Intruding noises can interfere with human activities by distracting attention and by making activities more difficult to perform, especially when concentration is needed. Interference from noise can even make some activities (such as communication or sleep) virtually impossible. Except in the case of speech interference, however, the degree of interference is hard to specify and difficult to relate to the level of noise exposure.
Because people's reactions to time-varying noise differ from moment to moment, and because people's reactions differ in general, protective levels for annoyance and activity interference are determined from data collected from groups of people, rather than from individuals. Fortunately, considerable data from social surveys of community reactions to noise exposure are available for this purpose. Although there are some shortcomings in practically all such data, sufficient agreement exists to allow confident predictions of the noise levels that lead to certain degrees of activity interference and annoyance.
Social surveys most often have been used to assess community reaction to noise exposure around airports. Table VI shows the percentage of people who reported noise interference with activities among a larger group which was extremely disturbed by aircraft noise.
It is hardly surprising that four of the nine activities in Table VI involve listening. Aircraft noise may also be found annoying because it may startle people, cause houses to shake, or elicit fear of a crash.
Another widely studied source of community noise exposure is vehicular traffic. Activity interference produced by traffic noise closely resembles that of aircraft noise, since interference with conversation, radio, television, and telephone use are all high on the list of activities disturbed.
| ACTIVITY | PERCENT |
|---|---|
| TV-Radio Reception Conversation Telephone Relaxing Outside Relaxing Inside Listening to Records/Tapes Sleep Reading Eating |
14.5 13.8 12.5 10.7 9.1 7.7 6.3 3.5 |
Two major indices of the cumulative effects of environmental noise on people are (A) specific actions taken by individuals or groups (such as complaints), and (B) responses to social survey questionnaires. Over the fast 25 years, numerous studies have been conducted to increase understanding of the relationship between noise exposure and its effects on people in communities.
Several factors beyond the magnitude of exposure have been found to influence community reaction. These factors include:
1. Duration of intruding noises and frequency of occurrence
2. Time of year (windows open or closed)
3. Time of day of noise exposure
4. Outdoor noise level in community when intruding noises are not present
5. History of prior exposure to the noise source
6. Attitude toward the noise source
7. Presence of pure tones or impulses.
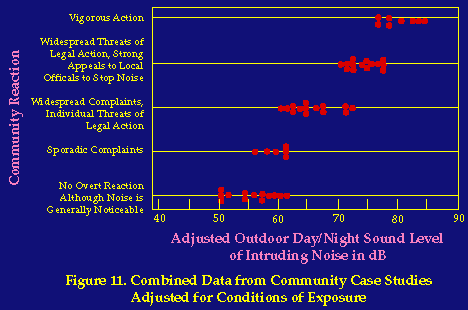
Since each of these factors may affect community reactions to noise exposure, adjustments for each have been developed to improve the predictability of community reactions beyond that available from a simple measure of exposure level. Figure 11 shows the results of several different case studies, relating Ldn (in dB) to community response with various correction factors added. The addition of the correction factors makes it possible to predict community reaction to within + 5 dB. As is common with annoyance and interference caused by noise, the effects of context and situation may be almost as important as the magnitude or intensity of the source. Caution is also needed in applying these relationships to communities that are significantly quieter than average urban areas.
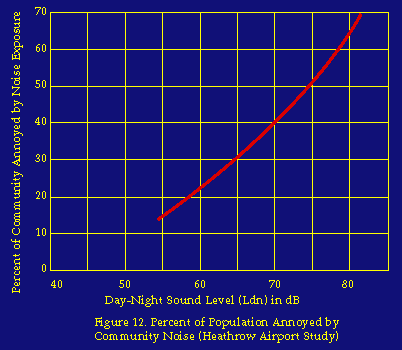
Extensive social surveys have been conducted around Heathrow Airport near London and at eight major airports in the United States. The relationship found in these surveys between noise exposure levels and the percentage of respondents who were considered annoyed by noise is summarized in Figure 12.
Q. Is annoyance simply a "welfare" effect?
A. Annoyance is a reflection of adverse effects which cannot be ascribed solely to "health" or "welfare." "Public health and welfare" in the context of the Noise Control Act is an indivisible term; there are no separate "health" effects or "welfare" effects. "Public health and welfare" includes personal comfort and well-being, and the absence of mental anguish, disturbances and annoyance as well as the absence of clinical symptoms such as hearing loss or demonstrable physiological injury.Q. What is annoyance due to noise?
A. Noise annoyance may be viewed as any negative subjective reaction to noise on the part of an individual or group. It is not an indication of weakness or inability to cope with stress on the part of the annoyed. More likely it signifies transient (or possibly lasting) stress beyond the control of the conscious individual. This is often expressed on social surveys as the percentage of people who express differing degrees of disturbance or dissatisfaction due to the noisiness of their environments. For the purpose of identifying protective noise levels, annoyance is quantified by using the percentage of people who are annoyed by noise. This is felt to be the best estimate of the average general adverse response of people, and in turn, is viewed as reflecting activity interference and the overall desire for quiet.Q. Are people annoyed at levels below an Ldn of 45 or 55 dB? Individuals, or even groups, may be annoyed by noise at low levels-the dripping faucet or humming fluorescent bulb are good examples. Annoyance depends very much on the situation, and on individual differences and noise durations.
Q. What do complaints represent?
A. Complaints are used by officials as an indication that a noise problem exists (although a noise problem may well exist in the absence of specific complaints). However, they do not necessarily represent the magnitude of a noise problem. The number of people who file complaints is only a very small percentage of those who are annoyed.Q. How is the margin of safety for annoyance applied?
A. The identified indoor level of Ldn = 45 incorporates a margin of safety for l00% protection of speech perception which is used as a surrogate for annoyance. The outdoor identified level of 55 Ldn protects speech outdoors to a level of 95% intelligibility at up to 2 meters, while incorporating a 5 dB margin of safety for speech, and giving added weight to the range of adverse effects.Q. Why is the nighttime penalty 10 decibels?
A. The 10 dB nighttime weighting had two bases: first, this weighting value has been applied successfully here and in other countries; secondly, in quiet environments, the natural drop in level from day to night is about l0 dB.
On the basis of its interpretation of available scientific information, EPA has identified a range of yearly Day-Night Sound Levels sufficient to protect public health and welfare from the effects of environmental noise. It is very important that these noise levels, summarized in Table VIII, not be misconstrued. Since the protective levels were derived without concern for technical or economic feasibility, and contain a margin of safety to insure their protective value, they must not be viewed as standards, criteria, regulations, or goals. Rather, they should be viewed as levels below which there is no reason to suspect that the general population will be at risk from any of the identified effects of noise.
| EFFECT | LEVEL | AREA |
|---|---|---|
| Hearing |
< 70 dB |
All areas (at the ear) |
| Outdoor activity interference and annoyance |
< 55 dB |
Outdoors in residential areas and farms and other outdoor areas where people spend widely varying amounts of time and other places in which quiet is a basis for use. |
| Outdoor activity interference and annoyance |
< 55 dB |
Outdoor areas where people spend limited amounts of time, such as school yards, playgrounds, etc. |
| Indoor activity interference and annoyance |
< 45 dB |
Indoor residential areas |
| Indoor activity interference and annoyance |
< 45 dB |
Other indoor areas with human activities such as schools, etc. |
Outdoor yearly levels on the Ldn scale are sufficient to protect public health and welfare if they do not exceed 55 dB in sensitive areas (residences, schools, and hospitals). Inside buildings, yearly levels on the Ldn scale are sufficient to protect public health and welfare if they do not exceed 45 dB. Maintaining 55 Ldn outdoors should ensure adequate protection for indoor living. To protect against hearing damage, one's 24-hour noise exposure at the ear should not exceed 70 dB.
Perhaps the most fundamental misuse of the Levels Document is treatment of the identified levels as regulatory goals. They are not regulatory goals; they are levels defined by a negotiated scientific consensus. These levels were developed without concern for economic and technological feasibility, are intentionally conservative to protect the most sensitive portion of the American population, and include an additional margin of safety. In short, the levels in Table VIII are neither more nor less than what Congress required them to be: levels of environmental noise requisite to protect the public health and welfare with an adequate margin of safety.
Q. Why doesn't the Levels Document explicitly say how much noise is too much noise?
A. Decisions about how much noise is too much noise for whom, for how long, and under what conditions demand consideration of economic, political, and technological matters far beyond the intent of the Levels Document. Such decisions are properly embodied in formal regulations, not informational publications such as the Levels Document.Q. How do I use this information for local purposes?
A. This question reflects the need to reconcile local economic and political realities with scientific information. People who formulate local noise abatement programs cannot escape the responsibility of making such economic and political compromises for their constituencies. The Levels Document does not impose arbitrary Federal decisions about the appropriateness of noise environments upon any level of government, nor is it a source of prescriptions for solving local noise problems. It is best viewed as a technical aid to local decision makers who seek to balance scientific information about effects of noise on people with other considerations, such as cost and technical feasibility.Q. If the identified noise levels are indeed sufficient to protect public health and welfare, shouldn't they be considered to be long-range regulatory goals?
A. Attainment of the identified levels of environmental noise can only be considered idealized goals. Pragmatically, it is unlikely that local, state, or Federal regulatory strategies will seek to attain such levels for all situations in the near future.Q. Why isn't the Levels Document more definite about specific effects associated with various noise exposure conditions?
A. Available knowledge about the effects of noise would not support more precise statements. Increasingly specific statements will be incorporated in future informational publications as they are justified by increasing knowledge of human response to noise exposure.
|
www.AVLELEC.com 8641 South Warhawk Road, Conifer Colorado 80433 Tel: 303-670-1099 ext. 11 * FAX: 303-679-8949 email: Patrick.McAllister@avlelec.com |